
Marketing Efficiency Ratio (MER) vs. ROAS: The New North Star for 2026
"Stop relying on broken ROAS data. Discover why smart brands are switching to Marketing Efficiency Ratio (MER) in 2026 to track true profitability, and learn how to calculate it for your business."
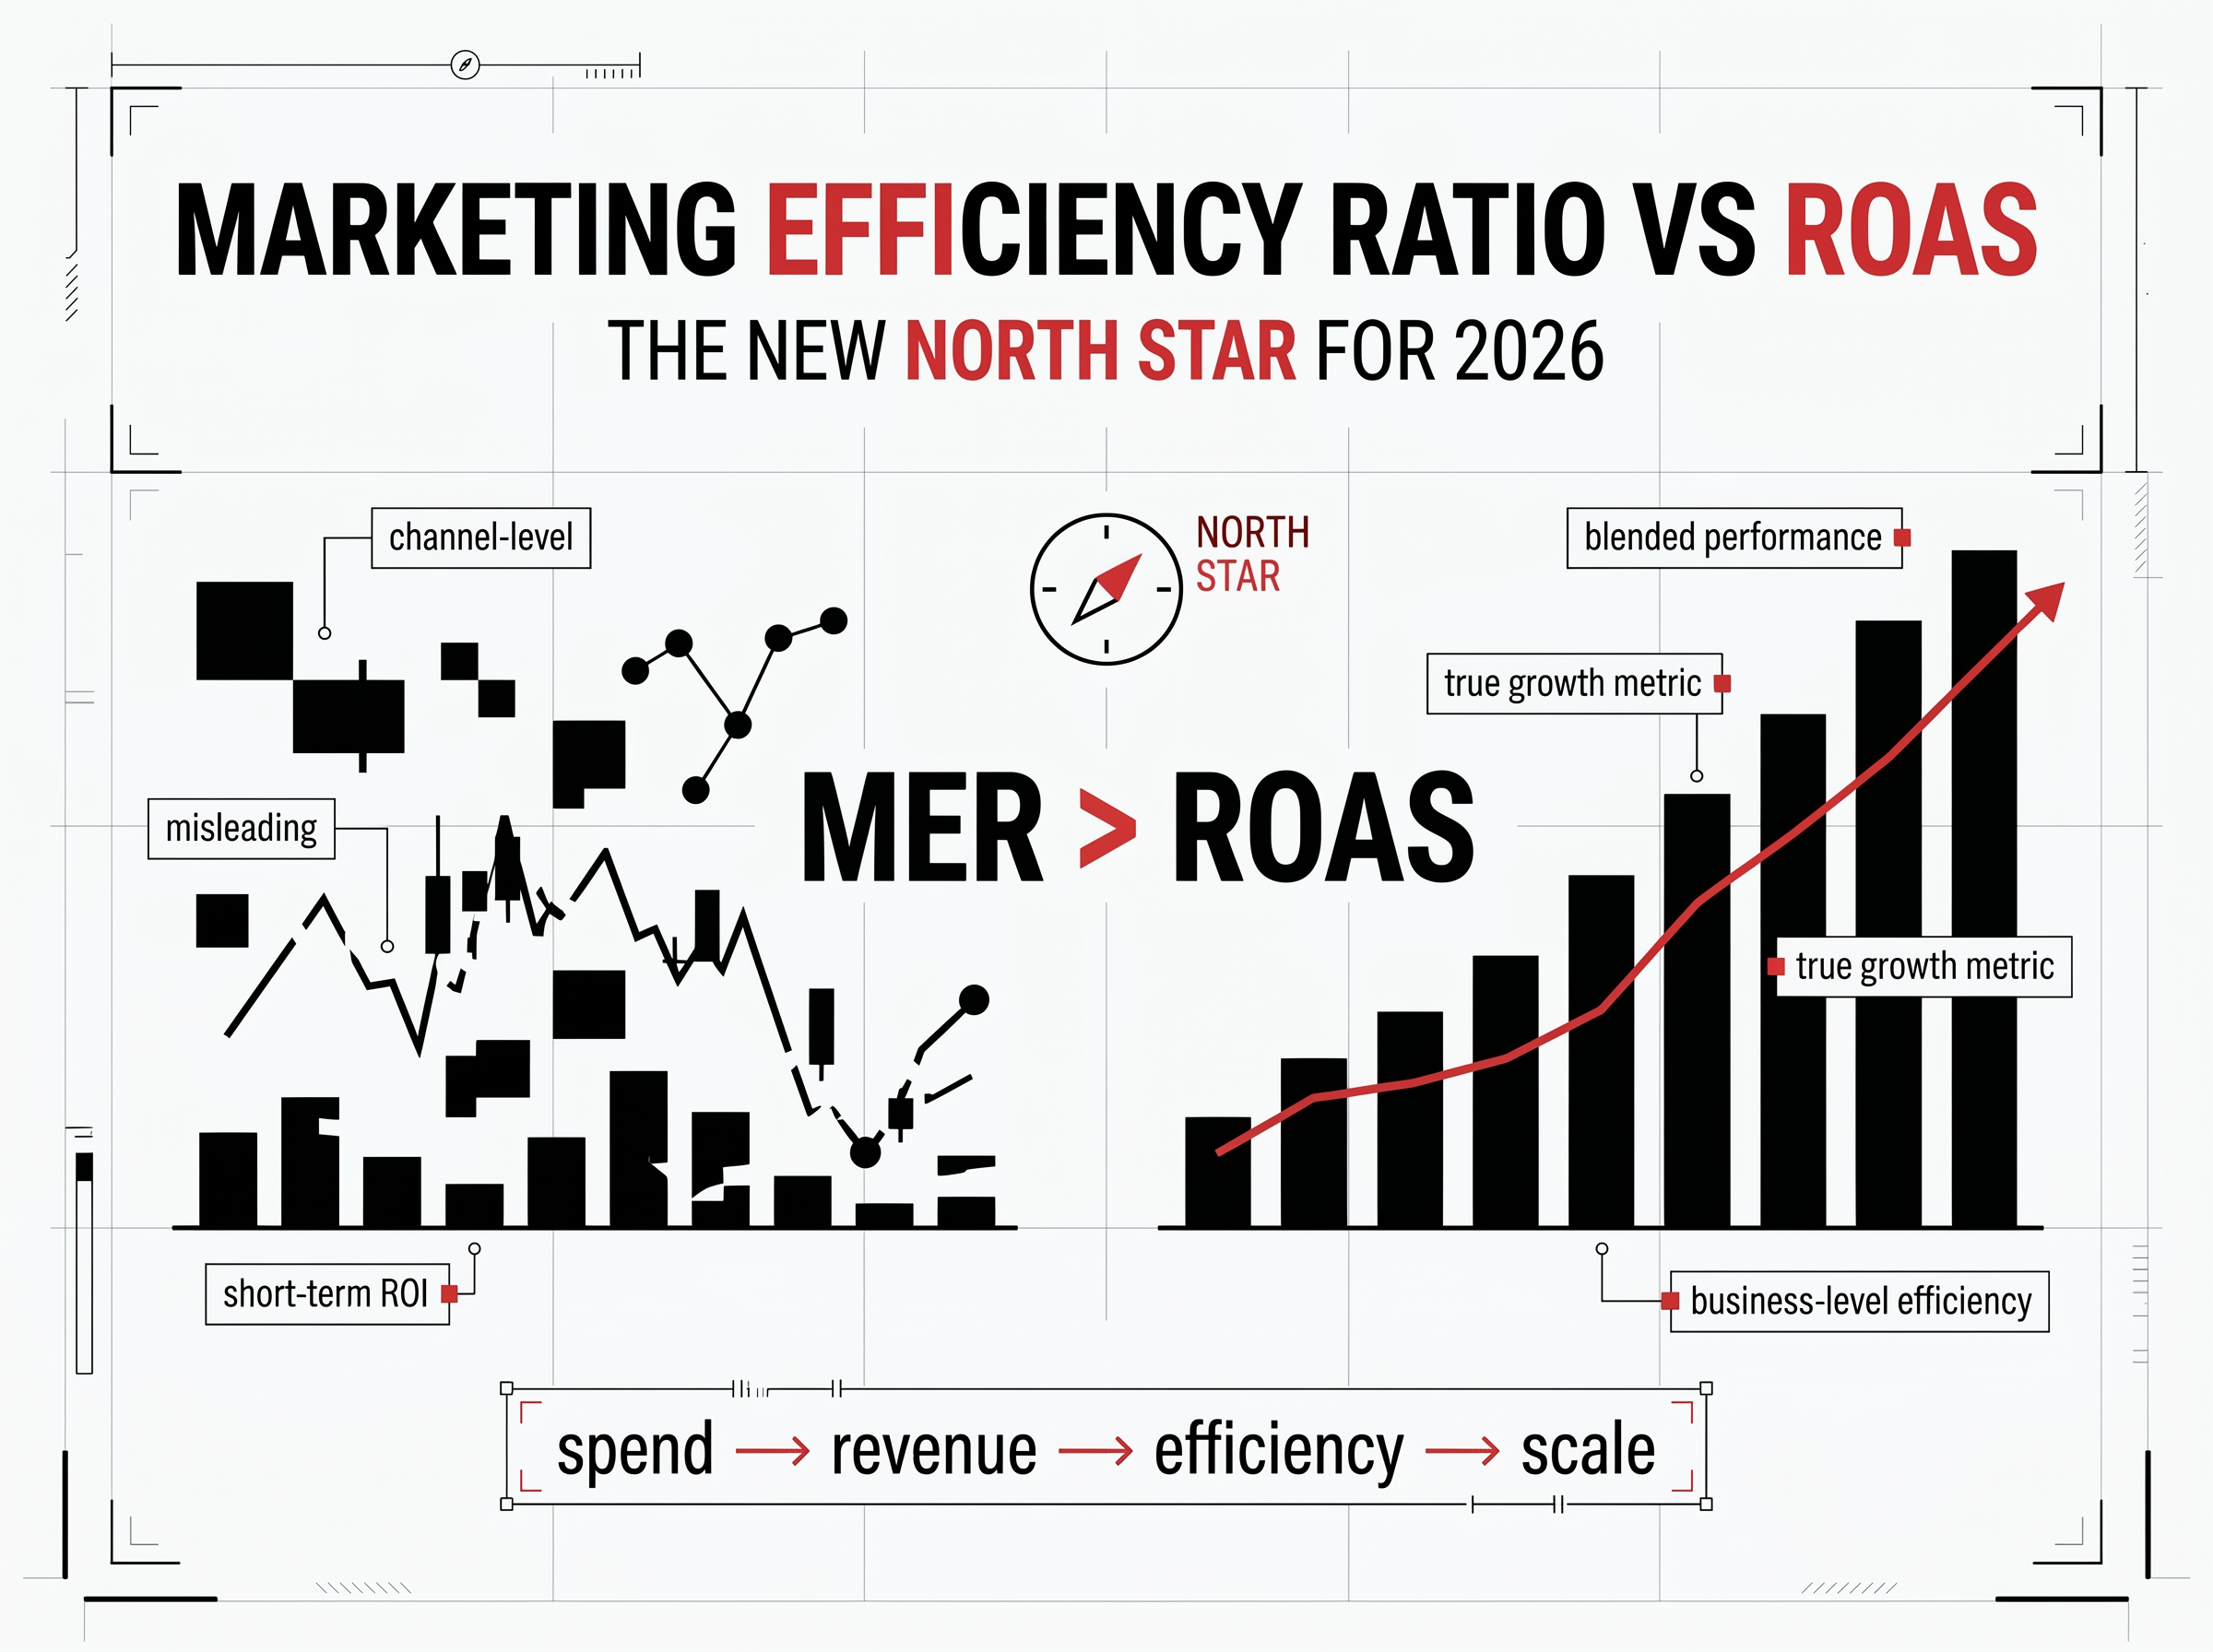
Marketing Efficiency Ratio (MER) vs. ROAS: The New North Star for 2026
If you are still optimizing your ad campaigns based solely on the ROAS (Return on Ad Spend) you see inside your Facebook or Google Ads dashboard, you are likely burning budget.
For a decade, digital marketers lived by a simple rule: Put $1 in, get $4 back. We trusted the pixel. We trusted the dashboard. But in 2026, relying on platform-specific attribution is a dangerous game.
Between iOS privacy updates, the death of third-party cookies, and the fragmentation of the user journey, the "ROAS" reported by ad platforms has become increasingly unreliable. It’s not uncommon for Facebook to claim a sale, Google to claim the same sale, and your email platform to claim it a third time.
To scale a brand profitably today, you need to zoom out. You need a metric that ignores the "attribution wars" and focuses on the bottom line.
Enter Marketing Efficiency Ratio (MER) the holistic metric that tells you if your business is actually making money.
The Death of Single-Channel Attribution
Why are we even talking about MER? Because the old way of tracking is broken.
Since the rollout of iOS 14.5 (and subsequent privacy updates like iOS 17’s Link Tracking Protection), "signal loss" has plagued performance marketing. Platforms like Meta and TikTok can no longer track users across the web with the precision they once had.
The Reality Check: Industry data suggests that platform-specific attribution has lost 15% to 30% of its visibility.
If you rely purely on in-platform ROAS, you might turn off a "low performing" Facebook campaign, only to watch your overall site revenue plummet the next day. This happens because that Facebook ad was driving awareness that converted later via Google Search—a connection ROAS misses, but MER captures.
Related Reading: Why Google Ads CPCs Are Skyrocketing in 2025 & Beyond
What is Marketing Efficiency Ratio (MER)?
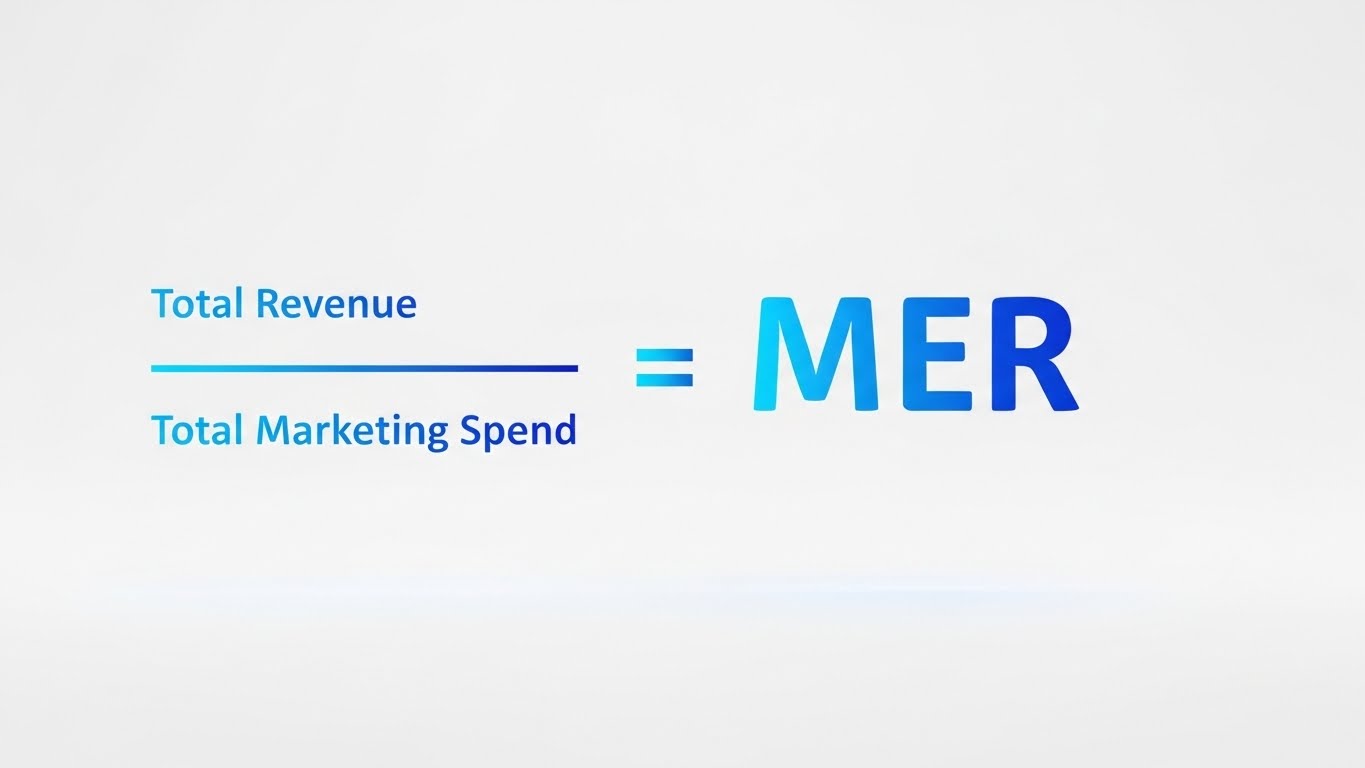
Marketing Efficiency Ratio (often called "Blended ROAS") is the simple, undeniable truth of your marketing performance. It looks at the relationship between Total Revenue and Total Ad Spend, regardless of where that spend happened.
The MER Formula
$$\text{MER} = \frac{\text{Total Revenue}}{\text{Total Marketing Spend}}$$
Example:
- You spent $10,000 on Facebook Ads.
- You spent $5,000 on Google Ads.
- You spent $5,000 on TikTok Ads.
- Total Spend: $20,000.
- Total Revenue (Shopify/Stripe): $80,000.
$$\text{MER} = \frac{80,000}{20,000} = 4.0$$
This means for every $1 dollar you spent on marketing (across all channels), $4 came back into the bank.
MER vs. ROAS: What’s the Difference?
Think of ROAS as a microscope and MER as a telescope. You need both, but they serve different purposes.
| Feature | ROAS (Return on Ad Spend) | MER (Marketing Efficiency Ratio) |
|---|---|---|
| Scope | Channel Specific (e.g., "Facebook ROAS") | Business Wide (All Channels) |
| User | Media Buyers & Ad Managers | Founders, CMOs, CFOs |
| Blind Spot | Misses cross-channel influence | Misses creative-level performance |
| Primary Goal | Optimization of specific ads | Profitability of the company |
The Strategic Shift:
Use ROAS to optimize specific creatives and audiences inside the ad accounts.
Use MER to decide how much total budget to deploy and to measure overall growth health.
How to Set Your Target MER for Profitability
A "good" MER is subjective—it depends entirely on your profit margins. However, for most e-commerce and SaaS brands in 2026, here are the benchmarks:
- MER < 2.0: The Danger Zone. Unless you have extremely high margins or are venture-backed and prioritizing aggressive growth over profit, you are likely losing money.
- MER 3.0 – 4.0: The Growth Sweet Spot. This is typically where scaling brands sit. You are profitable on the first order, but you are spending enough to acquire new customers aggressively.
- MER 5.0+: The "Too Safe" Zone. You are highly profitable, but you are likely leaving growth on the table. If your MER is a 7.0, you should probably increase your ad spend to capture more market share, even if efficiency drops slightly.
Pro Tip: Your target MER should be calculated based on your Break-Even Point.
Formula: 1 / (Gross Margin %)
The "Halo Effect": Why Blended Data Wins
This is where Performance Marketing meets Brand Marketing.
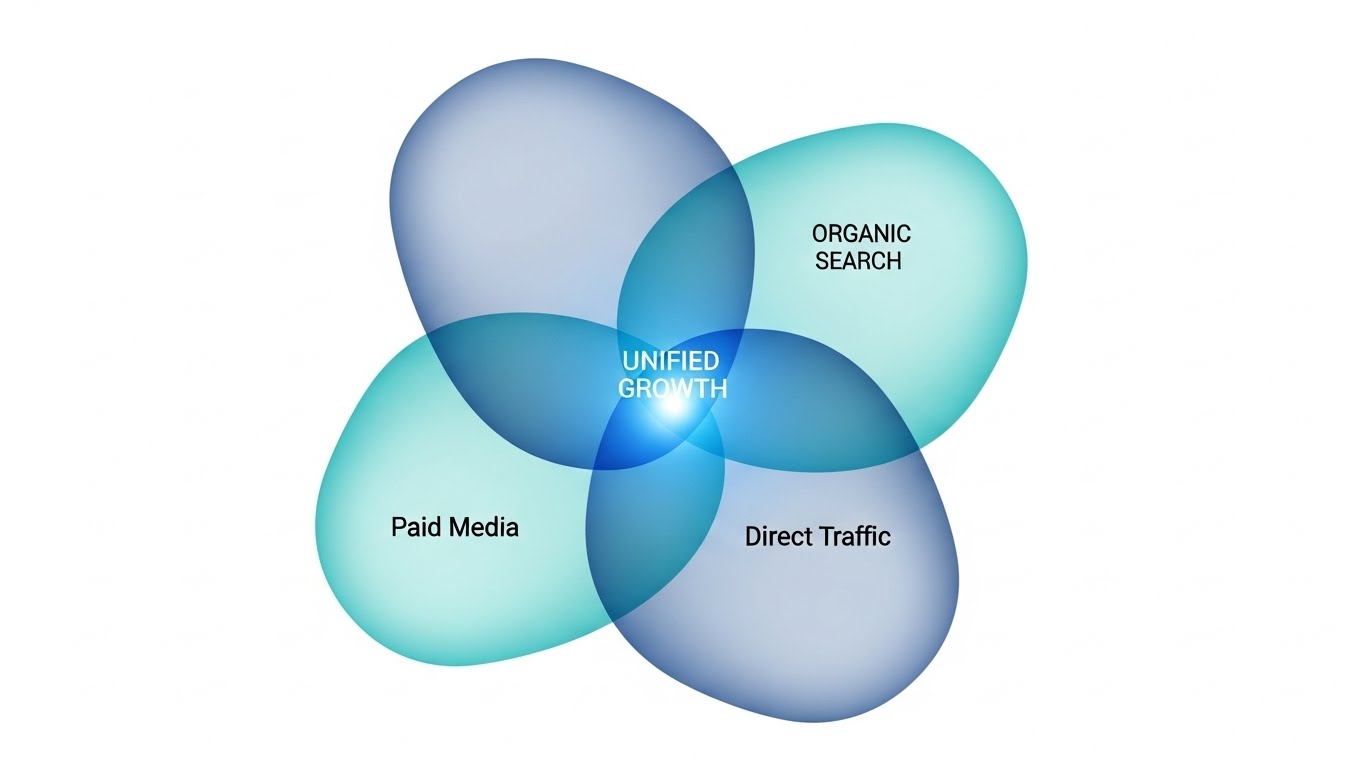
When you launch a high-impact TikTok campaign, you often see a spike in "Direct Traffic" or "Organic Search" traffic on Google. A user saw your video, didn't click, but later Googled your brand name.
- Google Analytics credits "Organic Search."
- TikTok Ads claims 0 conversions.
- ROAS looks terrible.
If you react to the low ROAS and cut the TikTok budget, your Organic Search traffic will likely dry up. MER protects you from this mistake. It allows you to see the "Halo Effect"—how top-of-funnel awareness drives bottom-of-funnel conversions.
- Related Reading: Performance Marketing vs Brand Marketing: Why Companies Require Both
Why You Need a Full-Stack Partner (The RPR Approach)
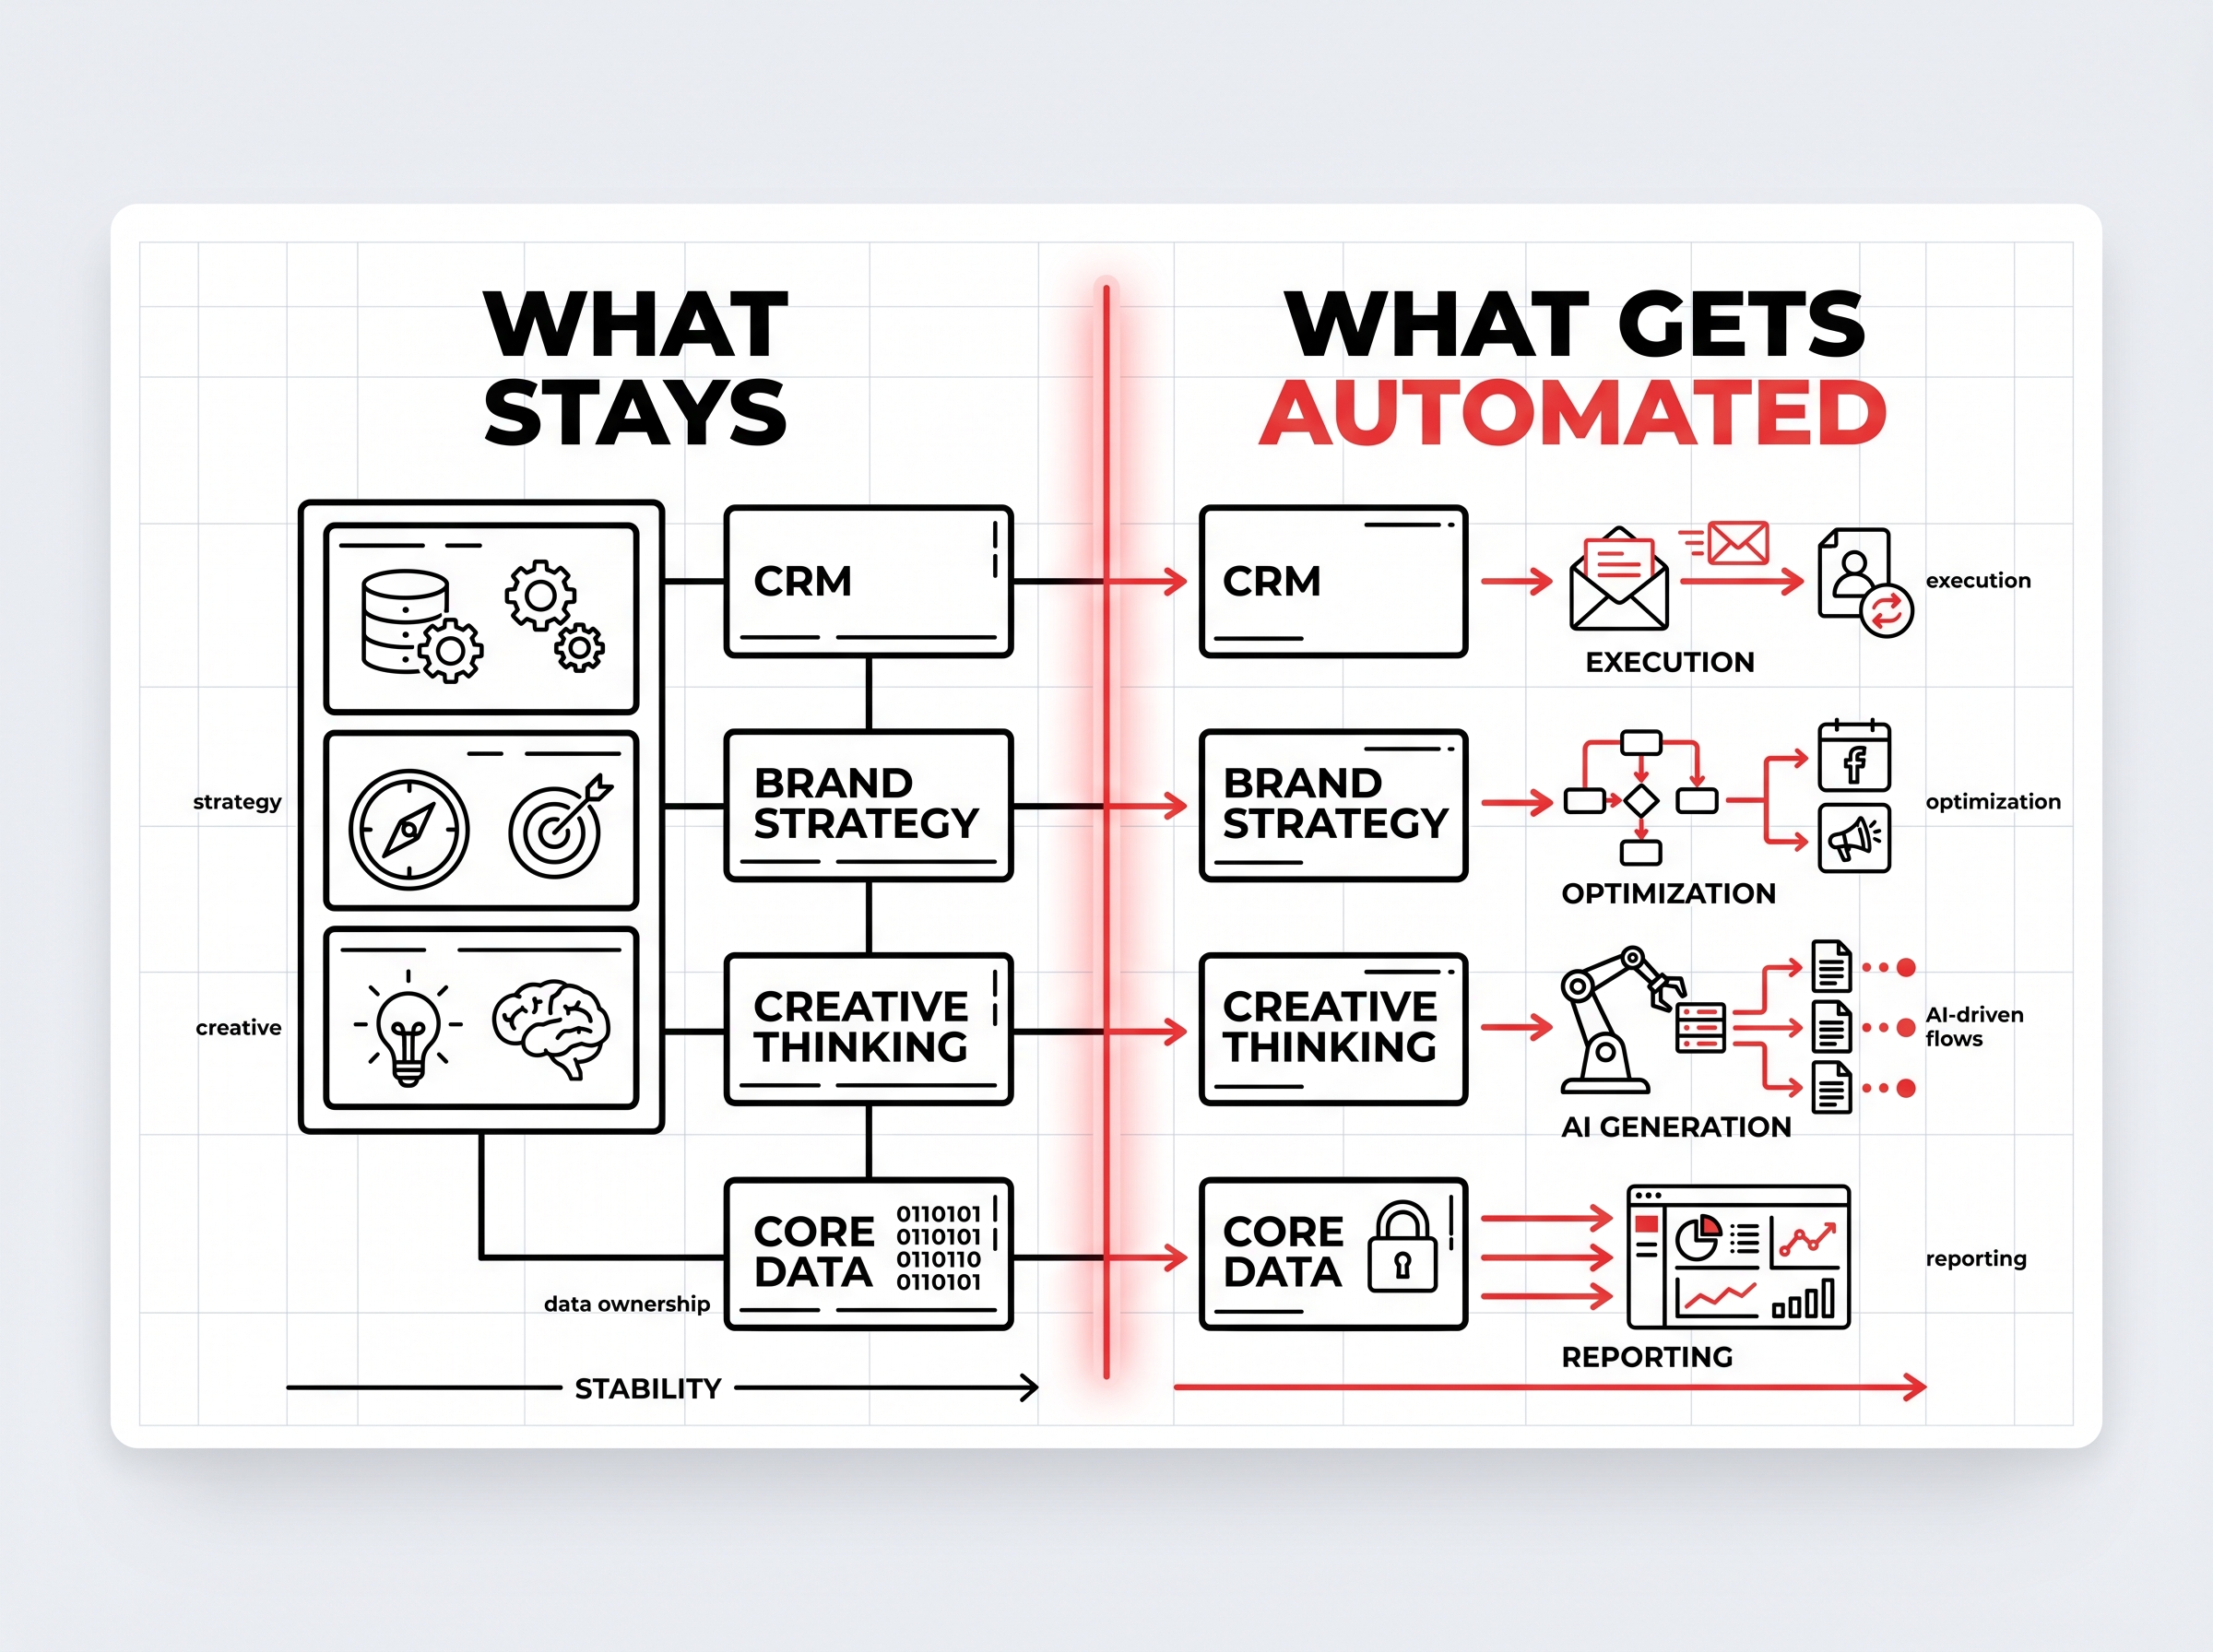
Improving your MER isn't just about tweaking Facebook ads. It's about the entire ecosystem.
You can have the best ad strategy in the world, but if your landing page loads slowly (Web Dev) or your creative looks outdated (Design), your MER will suffer.
At ROCKPAPER RUNWAY, we don't just buy media. We optimize every touchpoint that influences your MER:
- Performance Marketing: Data-driven ad buying on Google, Meta, and TikTok focused on profitability.
- Brand Marketing: Storytelling that builds trust and lowers your CAC (Customer Acquisition Cost) over time.
- Design & Creative: High-converting visuals that stop the scroll and drive clicks.
- Website & App Development: Blazing fast, SEO-optimized experiences that convert traffic into revenue.
- QA Testing: Ensuring your funnel works flawlessly so you never lose a sale to a bug.
When these 5 pillars work together, your Marketing Efficiency Ratio creates real, sustainable growth.
3 Steps to Implement MER Tracking Today
You don't need expensive software to start tracking MER, though tools like Triple Whale or Northbeam make it easier.
- Centralize Your Data: Create a simple spreadsheet (or Looker Studio dashboard) that pulls spend from Facebook, Google, LinkedIn, and TikTok.
- Pull Real Revenue: Connect your Shopify, WooCommerce, or CRM revenue data. Do not use the conversion value reported by the ad platforms.
- Track Weekly: MER fluctuates. Check it on a weekly basis, not daily. If your MER dips below your target for 2 weeks straight, it’s time to audit your creative or offer—not just your bid caps.
Conclusion: Moving From "Buying Clicks" to "Buying Customers"
In the cookie-less future of 2026, the brands that win won't be the ones obsessing over a 0.2 difference in Facebook ROAS. They will be the brands that understand their unit economics and manage their marketing aimed at total business health.
Stop letting the ad platforms grade their own homework. Switch your North Star to MER, and take control of your profitability.
Struggling to define your measurement strategy?
Don't scale into the red. Contact RPR’s Performance Team today for a comprehensive audit of your tracking stack and profitability strategy.
Frequently Asked Questions (FAQ)
Q: Is MER the same as Blended ROAS?
A: Yes, in most marketing contexts, MER (Marketing Efficiency Ratio) and Blended ROAS are used interchangeably. Both refer to Total Revenue divided by Total Ad Spend.
Q: Can I ignore ROAS if I track MER?
A: No. ROAS is still critical for the media buyer to determine which specific ad creative or keyword is performing best. MER is for the business leader to determine if the overall strategy is profitable.
Q: How does First-Party Data help with MER?
A: First-party data allows you to feed better customer signals back into ad platforms, improving their targeting algorithms. This eventually lifts your total revenue, improving your MER.
Read More: First-Party Data: How to Win in a Cookie-less 2025
Key Takeaways
- ✓ROAS is misleading: Due to iOS privacy updates and cookie loss, platform-reported ROAS can miss up to 30% of your actual conversion data.
- ✓MER is the truth: Marketing Efficiency Ratio (Total Revenue / Total Spend) gives you a holistic view of your business health, not just ad performance.
- ✓The "Halo Effect": MER captures how paid ads assist organic search and direct traffic—something standard ROAS attribution ignores.
- ✓Profit over vanity: Optimizing for MER ensures you are making actual profit, not just chasing "cheap clicks" that don't convert.


Discussion
Be the first to start the conversation.
Leave a Comment